Showing posts with label Solutions to Java Problems. Show all posts

PermGen Space eclipse

PermGen Space eclipse


One of the reason is due to changes in "Java 6u21 distribution"

The change was done in "java.dll" to replace "Sun MicroSystems" to "Oracle Corporation"

Solutions :

1, Degrade to java 6u20 version

2, Create a shortcut of eclipse.exe (For eg., Desktop shortcut) , right-click on the shortcut icon and click properties , properties dialog will appear , find the field 'target' and modify PermGen Space by starting eclipse with "-vmargs -XX:PermSize=64M -XX:MaxPermSize=128M" as below

eclipse -vmargs -XX:PermSize=64M -XX:MaxPermSize=128M

Decompile java code with Cavaj


Decompilers are used commonly for reconstructing the lost code and is used across different programming languages and in all platforms. The use of decompilers in java programming language is quite high compared to other ones. I have written an article about Java Decompilers last year which talks about the best open-source and commercial decompilers. I missed an important freeware java decompiler called Cavaj which helps you decompile java source code from class files recovering the lost source code.

Cavaj reconstructs the source code with the Class View providing instant access to methods and fields in the form of a tree view. The good thing about Cavaj Java Decompiler is, it doesn’t require you to have Java installed to use the decompiler and it is just a light weight stand-alone application. Cavaj Java decompiler uses Jad as its Java decompiling engine which makes the application light weight and handy. Check it out guyz.

Invoking an EJB deployed in WAS using Java Client

EJB’s popularly known as Enterprise Java Beans are one of the state-of-the-art feature of J2EE. EJB’s are mainly used for handling transactions, security, providing remote services etc. Even though lot of Object Relational Mapping Frameworks like Hibernate has replaced EJB’s which is considered to be so heavy in any Enterprise Application. Invoking an EJB inside the Application Server Container is quite simple and process is not as tedious when you try to do the same from outside the Application Server. Today I am going to explain how to invoke an EJB service which is deployed in a remote machine using a plain java client.

Who are qualified to be the clients?

EJB clients are those applications, components, systems, and services that try to access the EJB to fulfill a request or get a service. The client can be a device client , applet client , stand-alone java clients, EJB clients, CORBA clients, Legacy clients, JMS clients, windows clients and clients from other plat forms. Here I am gonna talk about only stand-alone java clients…

How java stand- alone client works?

Any java application can call an EJB service that is running on a remote application server using RMI calls. Since EJB’s internally uses RMI over IIOP.

How to access the EJB?

To look up an EJB that is remotely deployed, the stand-alone java clients has to make a look-up call through JNDI service running at a part icular port . JNDI is nothing but a naming-service which holds all the “object to name bindings” that exists in the server . Once they get the proper handle they can start to invoke the methods from the remote reference obtained using those handle. I am not here to explain the basics; just I have given an overview that ’s all.

How to create an EJB-Client.jar?

This is just to tell you how to create ejb-client .jar. What needs to be there?

1. EJB Remote Interface
2. EJB Home
3. Generated stubs
4. Necessary class files that can be used to invoke the remote methods.
5. Needed jars.

Make the client JAR available to the remote client . For Web applications, put the ejbclient.jar in the / lib directory. For non-Web clients, include ejb-client .jar in the client’s classpath. All the above said information is as per EJB-specification and from now onwards I am gonna proceed with Websphere specific information.

Points to be noted for Websphere:

1 . Websphere JNDI Standalone client will only work with the IBM JRE.
2 . And IBM does not ship their JRE standalone. (at least their 1.4 JRE)

Note: You will not face the above said problem in JBOSS and Weblogic. You just have to include the necessary jar that ’s all.

Why things are troubling us?

That was related to differences in the information used in the IBM orb and others. Sun changed the spec to ensure such issues went away. All complying implementations should interoperate out of the box now.

Process for Accessing the EJB services from Websphere:

This document provides the guidelines for accessing the Ejb services running in the Websphere Application server from any other external application servers or applications.

JAR Collection

To access the Ejb service some of the jar files have to include to the classpath of the application. This has to be collected from the Websphere lib directory. They are,

1 . bootstrap.jar
2 . ecutils.jar
3 . ffdc.jar
4 . idl.jar
5 . iwsorb.jar
6 . j2ee.jar
7 . lmproxy.jar
8 . naming.jar
9 . namingclient .jar
10 . ras.jar
11 . sas.jar
12 . utils.jar

JRE Collection

The compilation conflict occurs from the versions of the JRE used. As we access the IBM specific classes we need to have IBM jre collection. Create jre library from the java folder in the Websphere. And also it is must to use sun jre along with
that , and then include the j2ee.jar from sun provided J2SDKEE ( this holds the except ions of Ejb) .

1. IBM jre ( this library has to be created from the whole java directory)

2. SUN jre ( this library has to be created from jdk not jre)

3. j2ee.jar ( j2sdkee)

Properties

IBM maintains a property file for establishing connect ions with the iiop. So the application should include that property file. It is named as implfactory.properties

1. Implfactory.properties

Context Parameters

INITIAL_CONTEXT_FACTORY = com.ibm.websphere.naming.WsnInitialContextFactory
PROVIDER_URL = iiop: //hostname:2809

Enerjy for Java


Err is human thats what we say. Unit Testing, Code Review are considered as some of the bugging terms in the current software industry. It is because until now no software neither framework has been guranteed to be fool-proof or bug free. Testing of any software or an application can be done at two levels. One at usability and functionality level ie. nothing but black box testing. The second one is nothing but White box or glass box testing the internal structure of the application or software. In terms of Electrical Engineering this kind of testing is called ICT (In Circuit Testing). The success of a software or application is much dependent on White box testing for a long run in terms of scalability, maintenance, load-factor etc. You can find lot of opensource and licensed frameworks available in the market to test the internal structure of the design, framework, code etc. For Java development open-source tools like Junit, PMD, Hamurapi are the prominent frameworks that has been used wide across the industry. Now a new open-source framework called Enerjy joins the party.

Enerjy does something unique: it looks at Java code and produces the Enerjy Index – a 1-10 scale of integrity. This helps developers understand what parts of the code are likely to produce bugs – and why. Enerjy comes as a plugin for Eclipse. If you are familiar with Eclipse enviroment you can use it with ease. Enerjy has done a score of many of the existing best known Java-based open source projects. Here you can see them all, ranked by Enerjy Score. Click here to find the report. You can find a video about this framework in relation to the real world example below

http://www.youtube.com/watch?v=KYmO-20GTyQ


Enerjy has done lot of research and has collected data from lot of source metrics, identified fault-prone zones and has come up with this framework to solve any kind of potential issues with the code. Enerjy has hosted a support forum to handle all the issues, doubts that arises with the framework. Probably you guys can have look into it and comment about the same…

10 points about Java Heap Space or Java Heap Memory

10 points about Java Heap Space or Java Heap Memory

When I started java programming I didn't know what is java heap or what is heap space in Java, I was even not aware of where does object in Java gets created, it’s when I started doing professional programming I came across error java.lang.outofmemoryerror then I realized What is Heap in Java or Java Heap Space. Its happens with most of programmer because learning language is easy but learning basics is difficult since there is no formal process which can teach you every basics of programming its experience and work which reveals the secret of programming. For Java developer knowledge of Heap in Java, setting size of java heap space, dealing with java heap space outofmemoryerror, analyzing heap dumps is very important. This Java Heap tutorial is for my beginner brothers who are new in programming and learning it. It makes too much difference if you know the basics and underlying, until you know that object is created in heap, you won't be able to think why OutOfMemoryError occurs in Heap. I am trying to provide as much information about Heap in Java as I know but would like you guys to contribute and share your knowledge about Heap in Java to benefit all.

What is Heap space in Java?
When a Java program started Java Virtual Machine gets some memory from Operating System. Java Virtual Machine or JVM uses this memory for all its need and part of this memory is call java heap memory. Heap in Java generally located at bottom of address space and move upwards. whenever we create object using new operator or by any another means object is allocated memory from Heap and When object dies or garbage collected ,memory goes back to Heap space in Java, to learn more about garbage collection see how garbage collection works in Java.


How to increase size of Java Heap?
Default size of Heap in Java is 128MB on most of 32 bit Sun's JVM but its highly varies from JVM to JVM e.g. default maximum and start heap size for the 32-bit Solaris Operating System (SPARC Platform Edition) is -Xms=3670K and -Xmx=64M and Default values of heap size parameters on 64-bit systems have been increased up by approximately 30%. Also if you are using throughput garbage collector in Java 1.5 default maximum heap size of JVM would be Physical Memory/4 and default initial heap size would be Physical Memory/16. Another way to find default heap size of JVM is to start an application with default heap parameters and monitor in using JConsole which is available on JDK 1.5 onwards, on VMSummary tab you will be able to see maximum heap size.

By the way you can increase size of java heap space based on your application need and I always recommend this to avoid using default JVM heap values. if your application is large and lots of object created you can change size of heap space by using JVM command line options -Xms and -Xmx. Xms denotes starting size of Heap while Xmx denotes maximum size of Heap in Java. There is another parameter called -Xmn which denotes Size of new generation of Java Heap Space. Only thing is you can not change the size of Heap in Java dynamically, you can only provide Java Heap Size parameter while starting JVM.

Java Heap and Garbage Collection
As we know objects are created inside heap memory and Garbage collection is a process which removes dead objects from Java Heap space and returns memory back to Heap in Java. For the sake of Garbage collection Heap is divided into three main regions named as New Generation, Old or Tenured Generation and Perm space. New Generation of Java Heap is part of Java Heap memory where newly created object allocated memory, during the course of application object created and died but those remain live they got moved to Old or Tenured Generation by Java Garbage collector thread on Major collection. Perm space of Java Heap is where JVM stores Meta data about classes and methods, String pool and Class level details. You can see How Garbage collection works in Java for more information on Heap in Java and Garbage collection.

OutOfMemoryError in Java Heap
When JVM starts JVM heap space is the initial size of Heap specified by -Xms parameter, as application progress objects creates and JVM expands Heap space in Java to accommodate new objects. JVM also run garbage collector to reclaim memory back from dead objects. JVM expands Heap in Java some where near to Maximum Heap Size specified by -Xmx and if there is no more memory left for creating new object in java heap , JVM throws java.lang.outofmemoryerror and your application dies. Before throwing OutOfMemoryError No Space in Java Heap, JVM tries to run garbage collector to free any available space but even after that not much space available on Heap in Java it results into OutOfMemoryError. To resolve this error you need to understand your application object profile i.e. what kind of object you are creating, which objects are taking how much memory etc. you can use profiler or heap analyzer to troubleshoot OutOfMemoryError in Java. "java.lang.OutOfMemoryError: Java heap space" error messages denotes that Java heap does not have sufficient space and cannot be expanded further while "java.lang.OutOfMemoryError: PermGen space" error message comes when the permanent generation of Java Heap is full, the application will fail to load a class or to allocate an interned string.

Java Heap dump
Java Heap dump is a snapshot of Java Heap Memory at a particular time. This is very useful to analyze or troubleshoot any memory leak in Java or any Java.lang.outofmemoryerror. There is tools available inside JDK which helps you to take heap dump and there are heap analyzer available tool which helps you to analyze java heap dump. You can use "jmap" command to get java heap dump, this will create heap dump file and then you can use "jhat - Java Heap Analysis Tool" to analyze those heap dumps.

10 Points about Java Heap Space
1. Java Heap Memory is part of Memory allocated to JVM by Operating System.

2. Whenever we create objects they are created inside Heap in Java.

3. Java Heap space is divided into three regions or generation for sake of garbage collection called New Generation, Old or tenured Generation or Perm Space.

4. You can increase or change size of Java Heap space by using JVM command line option -Xms, -Xmx and -Xmn. don't forget to add word "M" or "G" after specifying size to indicate Mega or Giga. for example you can set java heap size to 258MB by executing following command java -Xmx256m HelloWord.

5. You can use either JConsole or Runtime.maxMemory(), Runtime.totalMemory(), Runtime.freeMemory() to query about Heap size programmatic in Java.

6. You can use command "jmap" to take Heap dump in Java and "jhat" to analyze that heap dump.

7. Java Heap space is different than Stack which is used to store call hierarchy and local variables.

8. Java Garbage collector is responsible for reclaiming memory from dead object and returning to Java Heap space.

9. Don’t panic when you get java.lang.outofmemoryerror, sometimes its just matter of increasing heap size but if it’s recurrent then look for memory leak in Java.

10. Use Profiler and Heap dump Analyzer tool to understand Java Heap space and how much memory is allocated to each object.

How to setup java remote debugging in eclipse?

How to setup java remote debugging in eclipse?

Remote debugging is not a new concept and many of you are aware of this just for who don’t know what is remote debugging? It’s a way of debugging any process could be Java or C++ running on some other location from your development machine. Since debugging is essential part of development and ability to debug your application not only saves time but also increase productivity. Local debugging is the best way in my opinion and should always be preferred over remote debugging but if local debugging is not possible and there is no way to debug your process then remote debugging is the solution.

Many of us work on a project which runs on Linux operating system and we do development mostly on Windows. Since I am working in Investment banking and finance domain I have seen use of Linux server for running electronic trading application quite a lot, which makes development difficult because you don't have code running on your development machine.

Some time we managed to run the project in windows itself which is essential for development and debugging purpose but many times its not possible due to various reason e.g. your project depends upon some of the platform dependent library or some Linux module whose windows version may not be available or your project is too big to run on windows and its heavily connected to upstream and downstream system its almost impossible to create same environment in your windows machine for development.
On such situation my approach to work is isolate the work I am doing and test that with the help of mock objects, Threads or by trying to run that module independently but this is also not a desired solution in some cases where you need to debug the project at run time to find out some subtle issues.


Eclipse provides us most useful feature called "Remote debugging" by using which you can debug your Linux running process from your windows machine. believe me this become absolutely necessary in some condition and knowing how to setup remote debugging and working of remote debugging in eclipse can greatly improve your productivity. In this Eclipse tutorial I will try to explain eclipse remote debugging or how to setup remote debugging in eclipse.

Now let's see how we can setup remote debugging in Eclipse:

1) First setup your java project in Eclipse.

2) Select your project, go to "Run" Menu option and select "Debug Configurations"

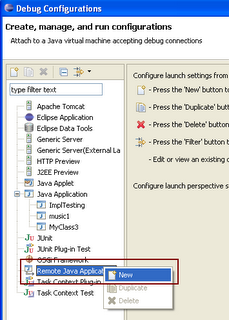
3) This will open Debug Configuration window select "Remote Java Application" icon on left side, Right click and say "New".4) After clicking on New, Eclipse will create Remote Java Application configuration for your selected project. Now next step is to setup host and port for remote debugging.


5) Now put the host name and port on which your process is listening for debugger in Linux machine. Check the "Allow termination of remote VM" check box if you would like to close java application running on Linux from eclipse.

6) Now you are all set to remote debug your project. but before starting to debug make sure your java process is started with java debug settings and listening on same host and port, otherwise eclipse will not able to connect successfully.

7) To debug just click the "Debug" button in last screen where we have setup host and port.

8) You can also debug by going to "Debug Configurations" selecting your project in "Remote Java Application” and clicking on "DEBUG".

Java remote debug setting and JVM debug options

In order to remote debug a java application, that application must be started with following JVM debug options:

java -Xdebug -Xrunjdwp:transport=dt_socket,address=8001,server=y suspend=y -jar stockTradingGUI.jar

This will start java applicaiton stockTradingGUI into debug mode using Java Debug Wire Protocol (jdwp) protocol and it will listen on port 8001
suspend=y will ensure that that application will not start running until eclipse connect it on speicified debug port.It also important to note
That application must be start before eclipse tries to connect it other wise Eclipse will throw error "Failed to connect to remote VM. Connection refused" or "Connection refused: connect"


Enjoy remote debugging in Eclipse


Tip: In JVM DEBUG parameters there is a parameter called "suspend" which takes value as "y" or "n". so if you want to debug the process from start set this parameter as "suspend=y" and your Java application will wait until Eclipse remotely connect to it. Otherwise if you want to run your program and later want eclipse to be connected that set this as "suspend=n" so your java application will run normally and after eclipse remotely connected to it, it will stop on breakpoints.


Tip: Use start up script to put JVM debug parameter and use a variable e.g. isDebugEnabled and also REMOTE_DEBUG_PORT in the script export this variable when you want to remote debug your Java application. This will be very handy and will require just one time setup work.


Tip: if you get error "Failed to connect to remote VM. Connection refused" or "Connection refused: connect" then there might be two possibility one your java program is not running on remote host and other you are giving incorrect port or host name after verifying these two things if issue still persists then try giving full name of the host.

Tip: You also need to ensure that you run the same codebase in eclipse which is deployed in your remote machine so that what you debug and see in eclipse is true and real. you also need to ensure that your code is compile with debug option "-g" so that eclipse can easily gather debug info e.g. information about local variable. by default java only generate line numbers and source file information.with debug option -g your class file size might be more because it would contain some debug information.

How to solve Address or Port already in use error in java?

How to solve Address or Port already in use error in java?

java.net.BindException: Address already in use: JVM Bind is one of the most popular error among java developers and guys who do socket


programming in some other language too. But with respect to java this error is much familiar with socket programming and during web development. This error

happens for ports 80 (HTTP) , 1098 (RMI) when it is used by other applications that is running on the same PC or server. So I am going to explain how to debug and solve this problem.


Step I : Finding the ports that are in use:

1. You can use the tool CurrPorts to solve this problem. You can google about the tool. How to find open ports in your PC?

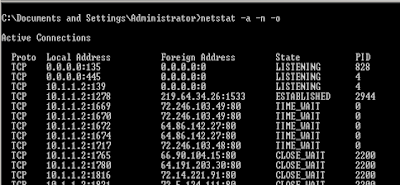
2. If you are using windows XP you can use the netstat command to view which processing is occupying the port. If you use Windows 2000 then you cannot use the ‘ netstat -o ‘ in your netstat command which tells you the process ID that is using the port. So in windows 2000 use the tool CurrPorts which is free.

eg) netstat -ano

Note:

If you have problem with port 1098 then check whether outlook or firefox is currently in use and close the same to free the port. This is just an example and for a better report you can use the tools mentioned above.

Step II : Free up the port:

You can free up the port by 3 ways,

1. If you use CurrPorts tool then you can find the application that is using it and you can close it down or kill the process by right clicking in the tool.

2. In windows you can use the command ‘ taskkill /PID 828 ‘ to kill the appropriate process.

3. Making your program to use a different port. For instance if you are encountering this error with JBOSS Application server for port 80, then you can go to server.xml in the appropriate directory say server/default/deploy/jbossweb-tomcatXX.sar/server.xml and change the port to 8080 to avoid the conflict. In case of Tomcat look for server.xml in the conf directory


Hope the above explanation helps. Feel free to comment.

Popular Posts